Value buys
Screens for cards trading under their recent prices. Each list is a labelled heuristic over our own price history — use it to find cards worth a closer look, not as advice. Cards whose 30-day high is more than 2.5× their low are skipped: too illiquid for an average to mean anything.
Heuristics computed from public market prices — not financial advice. Market prices are estimates, not offers.
Today's screen
of 30,762 cards with 30 days of prices- cards ≥ 10% under their 30-day average
- 199
- cards ≥ 10% under their 30-day average
- cards at their 30-day low
- 444
- cards at their 30-day low
- high-value cards down 5%+ this week
- 40
- high-value cards down 5%+ this week
- established cards down 40%+ in a year
- 23
- established cards down 40%+ in a year
- the median card vs its 30-day average
- +0.5%
- the median card vs its 30-day average
Below their 30-day average
Price ≥ $5, at least 10% under the 30-day average, with ≥ 20 daily prices in 30 days (same source).
- 1
 Beedrill 001/112FireRed & LeafGreen · Energy Symbol Reverse Holo$35.00−46.5% vs 30-day avg · $65.41
- 2
 Shining Mewtwo 109/105Neo Destiny$500.00−45.4% vs 30-day avg · $915.00
- 3
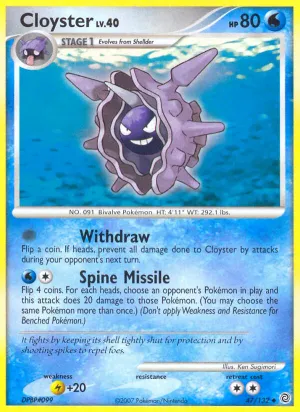 Cloyster 047/132Secret Wonders · Reverse Holo$6.80−45.4% vs 30-day avg · $12.44
- 4
 Pikachu ex 109MEP Black Star Promos$124.16−43.6% vs 30-day avg · $220.17
- 5
 Minun 071/147Supreme Victors · Reverse Holo$19.99−39.4% vs 30-day avg · $32.99
At their 30-day low
Price ≥ $5 at the lowest of the last 30 days and ≥ 5% under the 30-day average, with ≥ 20 daily prices.
Dips on high-value cards
Price ≥ $100 that fell 5% or more in 7 days (same source), with ≥ 20 daily prices.
Down 40%+ in a year
Price ≥ $20 at least 40% under its comparable price a year ago, in a set out 15+ months, with a calm last 30 days (high ≤ 2× low) and not still sliding this week.
Rebounding
Price ≥ $10 that fell 15% or more over 30 days and is up 5% or more in the last 7 (same source).
Cheapest chase cards in hot sets
Cheapest illustration / ultra / secret rares in the 5 sets whose index rose most in 7 days.
Build your own screenElite+
Filter every card with a healthy 30-day price history by name, set, era, rarity, price and discount vs its 30-day average.
How these numbers are computed
- Price: the TCGplayer market price (USD) of ONE printing. Never another printing or grade; unpriced stays unpriced.
- Changes: latest price vs the same printing's price 1, 7, 30, 90 or 365 days earlier (±1 day). Both prices come from TCGplayer; a missing day is never guessed.
- Rankings: both prices ≥ $2, latest price at most 3 days old, and moves beyond sanity caps (e.g. +200% in a day) held back for review.
- Indexes: chain-linked, base 100 on the first tracked day. Each day's change is Σ today ÷ Σ yesterday over the printings priced on both days by the same source — new listings and source switches never move them.
- Volatility: standard deviation of daily log price changes over 30 days (≥ 10 consecutive-day returns). Trend: least-squares slope of the log price over 30 days.
- History started on September 29, 2025. Each window appears once both of its endpoints exist; until then it says when it will be available.
Heuristics computed from public market prices — not financial advice. Market prices are estimates, not offers.